Comparaison des versions

Légende

  • Ces lignes ont été ajoutées. Ce mot a été ajouté.
  • Ces lignes ont été supprimées. Ce mot a été supprimé.
  • La mise en forme a été modifiée.
Sv translation
languagefr
Remarque

Cette page n'est plus actualisée. À partir de BlueMind 4.8, veuillez consulter la nouvelle documentation BlueMind

Remarque

La console de monitoring est dépréciée en version 4.0. La supervision se fait désormais par l'outil intégré bm-tick.


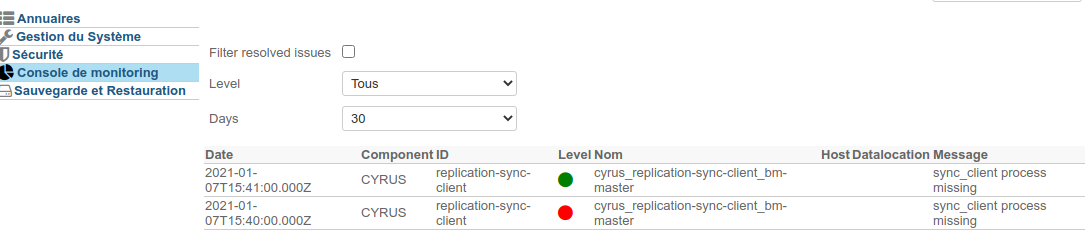
A partir de la version 4.4 de BlueMind, la page de console de monitoring de la console d'administration présente les alertes levées par TICK :

Image Added

Sv translation
languageen
Remarque

This page is no longer being updated. From BlueMind 4.8, please refer to the new BlueMind documentation

Remarque

La console de monitoring est dépréciée en version 4.0. La supervision se fait désormais par l'outil intégré bm-tick.

Sv translation
languagede
Remarque

Diese Seite ist nicht mehr aktuell. Ab der Version BlueMind 4.8 finden Sie alle Infos in der neuen Dokumentation

Remarque

Die Monitoringkonsole in Version 4.0 ist obsolet. Das Monitoring erfolgt nun über das integrierte bm-tick Tool.


Ab BlueMind Version 4.4 werden auf der Seite Monitoringkonsole der Administrationskonsole die von TICK ausgelösten Alarme angezeigt:

Image Added

Introduction

Image Removed Available starting from BlueMind version 3.5.5, the monitoring console is a tool that enables you to check the health of a BlueMind server quickly. It checks server settings, memory and available space as well as many internal BlueMind components.

All checks can be accessed through the API, which means the monitoring console can be integrated into all monitoring systems. Please note that it does not substitute for a monitoring system and does not manage result history.

Volet
borderWidth3

On this page:

Sommaire
maxLevel2

Related:

Installation

Install the node-monitoring plugin on all servers:

Bloc de code
aptitude install bm-plugin-node-monitoring


Then the following two plugins on the main server:

Bloc de code
aptitude install bm-plugin-core-monitoring bm-plugin-admin-console-monitoring

The first enables you to communicate with previously installed nodes and the second provides the admin console's graphical interface.

Finally, restart BlueMind:
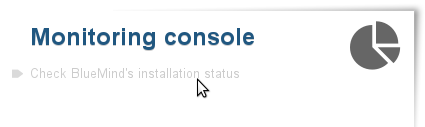
Bloc de code
bmctl restart

Using the Monitoring Console

Once installed, a new section named "Monitoring console" appears in the admin console:

Image Removed

Astuce
titleAccess to the monitoring console

Access to the monitoring console is subject to the assignation of a role. Administrators with access to the admin console will see the new section, but it remains grayed out until they are assigned the proper role.

Image Removed

To enable access to this section, the user/administrator must be granted the new role now available in the user's directory entry form ("General" tab):

Image Removed

To find out more about user roles, go to the page Gestion des entités > Administration des utilisateurs

Clicking the link opens the monitoring scripts and shows the status of the server and services:

Image Removed

  • The "General information" section shows general BlueMind information: number of users and groups, subscription information, installed version
  • the top right corner shows the system information for the main server BlueMind is installed on
  • the main section shows the status of services.
    • The Image Removed buttons allow you to filter the processes according to their status: the table will show the services whose status match the button(s) that are enabled.
    • Clicking a column header sorts that column alphabetically.
      Clicking a column that is already sorted reverses that column's sorting order.
Enregistrer

Enregistrer

Enregistrer